Xdebug
Xdebug can be used to debug both web requests as well as cli scripts (e.g., Drush commands).
Setup
xdebug extension is disabled by default since it causes about a 20% performance hit. To enable it:
fin config set XDEBUG_ENABLED=1
fin project start
To verify that Xdebug was enabled run:
$ fin exec php -v | grep -i xdebug
    with Xdebug v2.5.1, Copyright (c) 2002-2017, by Derick Rethans
Note: Starting with Docksal v1.6.0 (and assuming the default stack is used), installing the companion browser extension is no longer necessary. Once Xdebug is enabled, debugging sessions will be started automatically.
Debugging Drush 8
To debug Drush 8 commands, a path mapping will need to be made for the internal drush binary and the IDE. We recommend copying the drush binary to your local project and using file mapping.
This can be done by running the following in the project root:
$ mkdir bin
$ fin exec cp /usr/local/bin/drush8 ./bin/drush
Debugging with PHPStorm
Web Requests
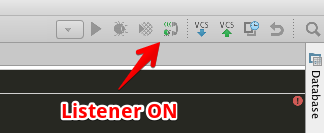
1) Open a project in PHPStorm and set a breakpoint wherever you like 2) Click on the Start Listening for PHP Debug Connections button in PHPStorm
3) Open the project in a browser
A debugging session will start and Xdebug will initialize a connection to PHPStorm.
4) Click on Accept in the Incoming Connection From Xdebug dialogue in PHPStorm
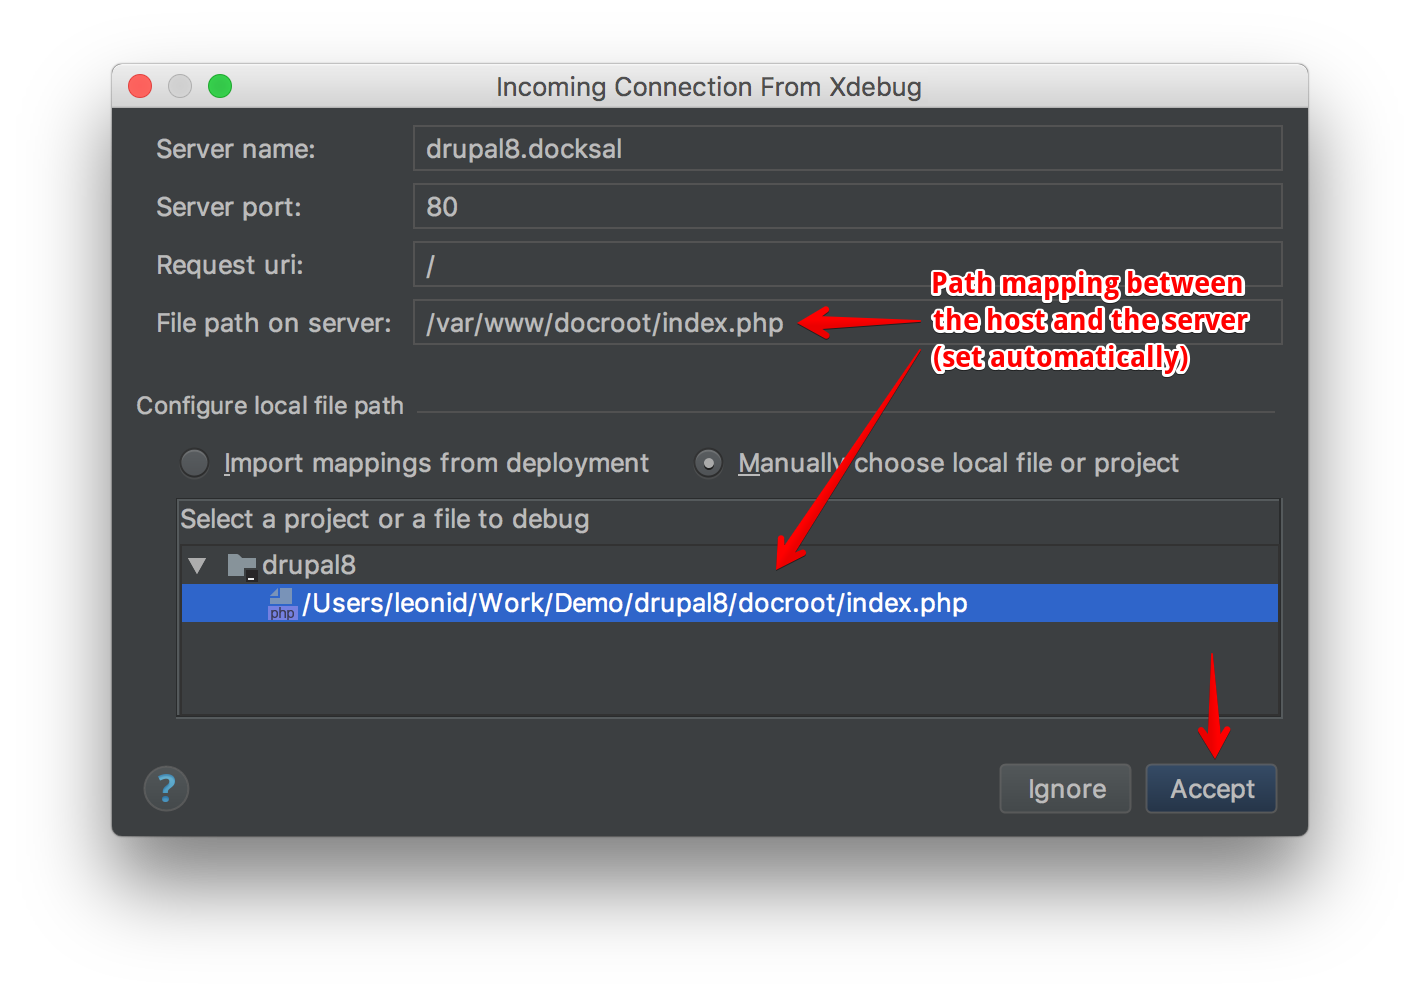
PHPStorm will automatically configure a server and directory mappings between the host and the server.
Directory mappings are very important, as that’s how PHPStorm knows how to map sources on the server to those on the host. You will not be able to debug anything above the project’s docroot folder by defaut.
If you don’t get the Incoming Connection From Xdebug dialogue, use the following manual steps:
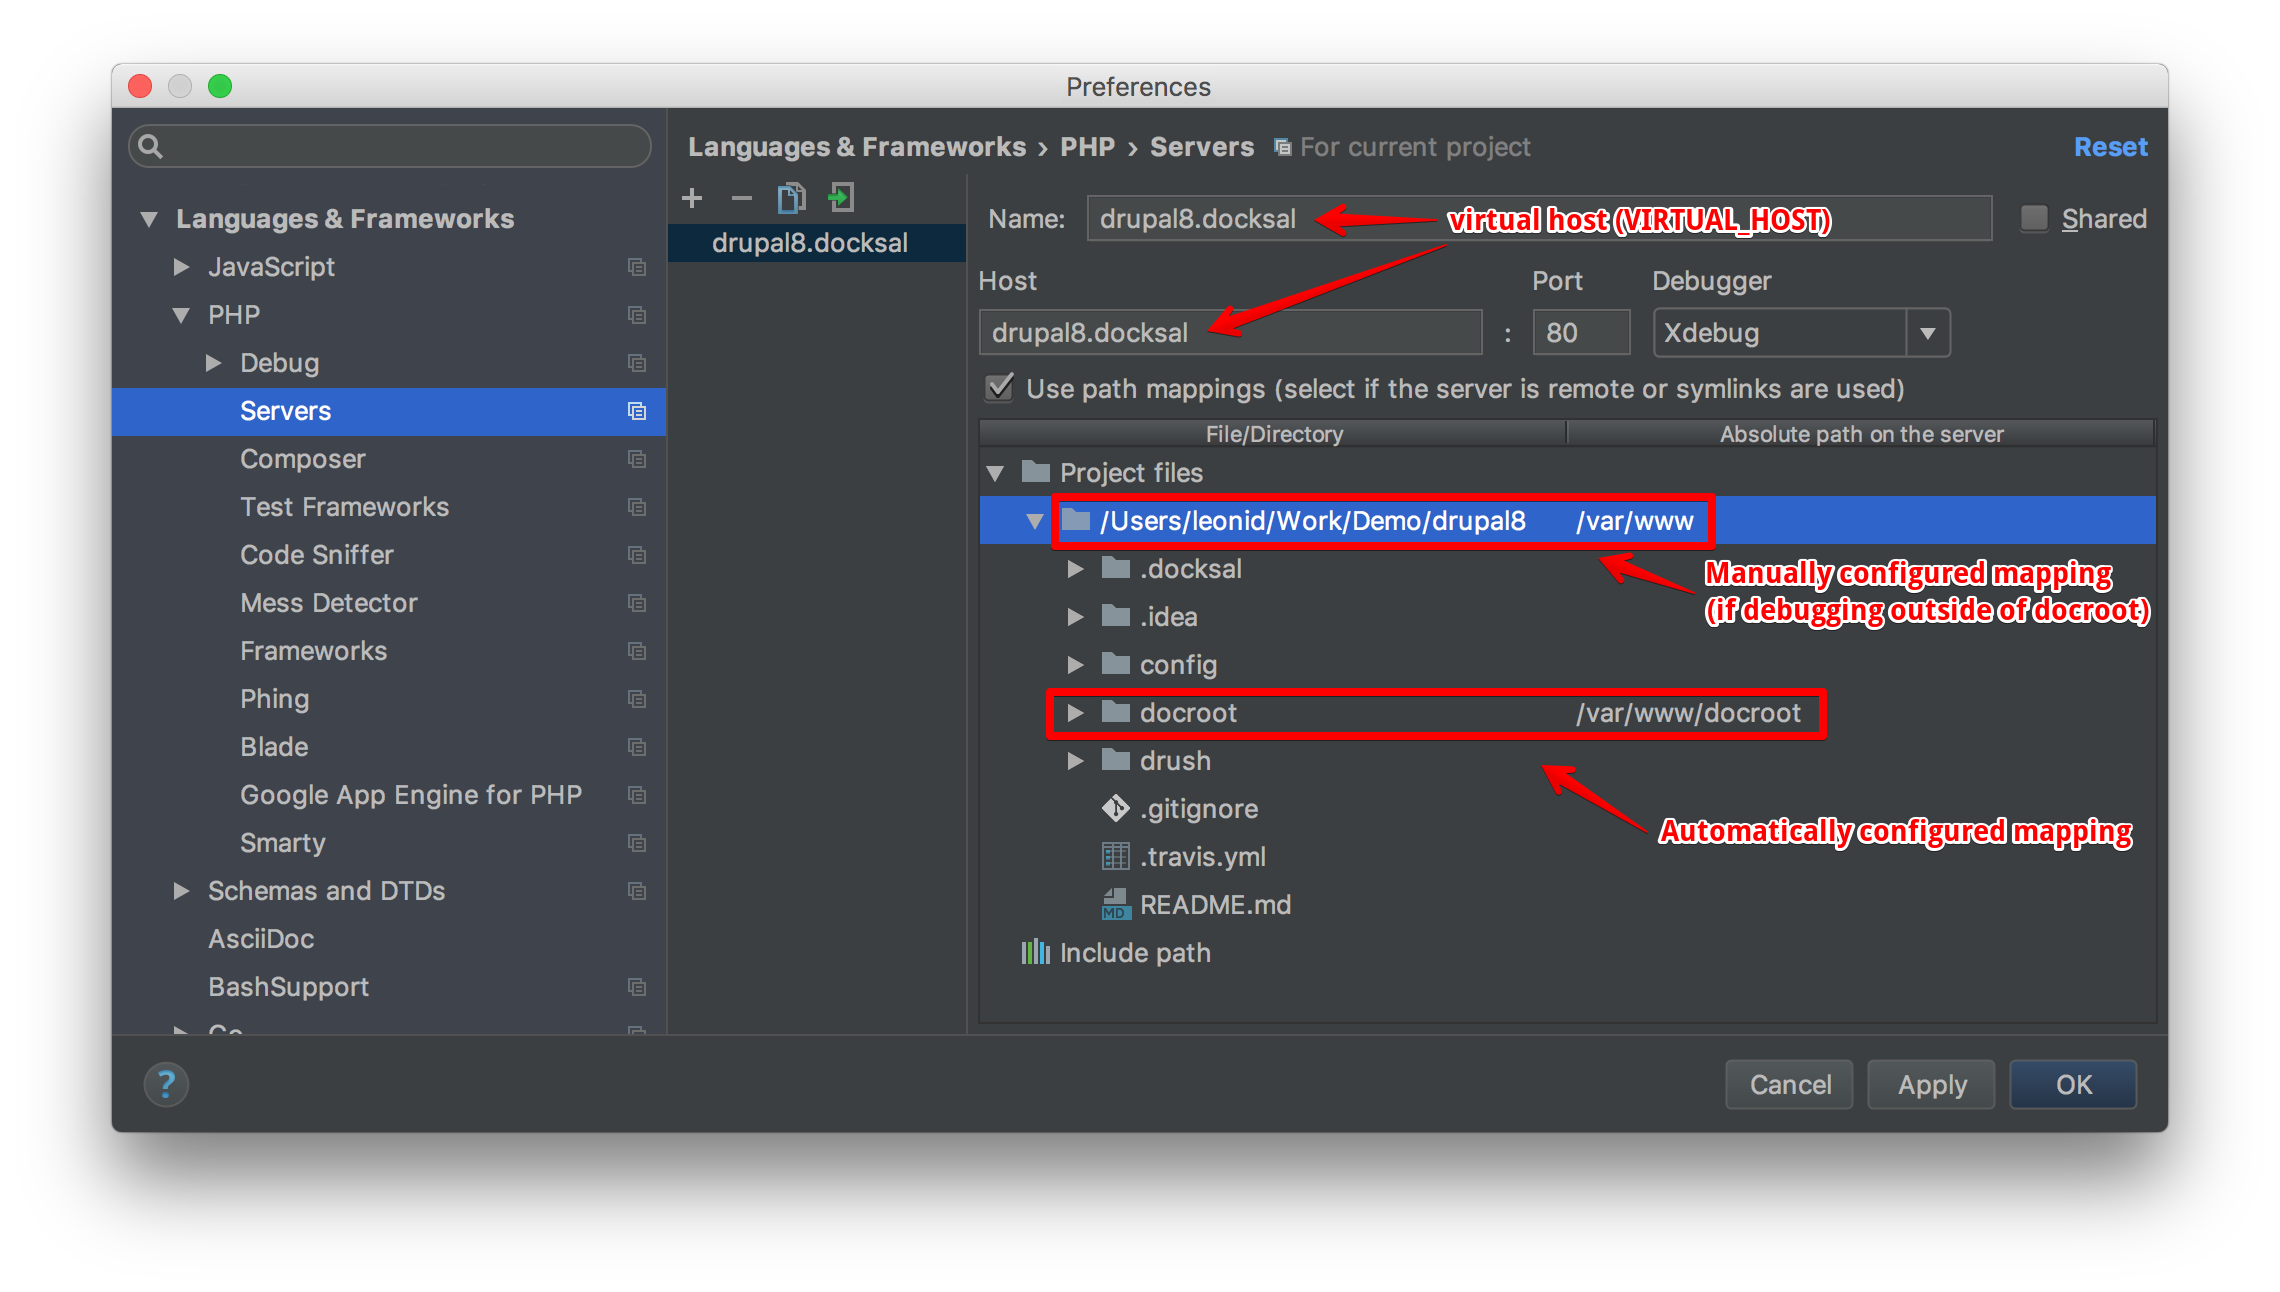
1) Under Preferences > Languages & Frameworks > PHP > Servers add a new server
2) Set Name and Hostname to project’s virtual host (VIRTUAL_HOST)
3) Configure host to server directory mappings
Map the project directory on the host to /var/www on the server:
Console Scripts and Drush
Make sure you have the server and directory mapping already configured following the instructions for web request debugging.
Keep in mind, the script you are trying to debug must reside within the project folder or PHPStorm won’t be able to access its code (and thus debug it). Specifically, this means that you can only debug Drush and Drupal Console instances local to the project (installed with Composer as project level dependencies).
Note: If drush is run before web request debugging is configured, PHPStorm will not automatically configure the server and directory mappings for you. You will have to do this manually (see instructions for manual configuration above).
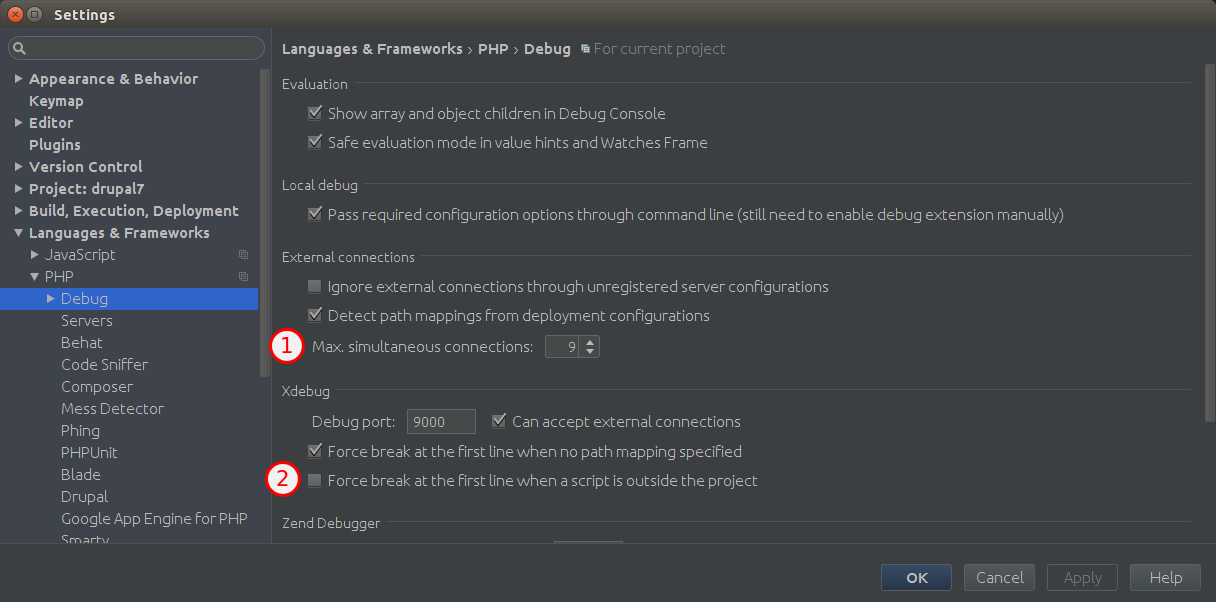
(1) Increase the Max. simultaneous connections to allow drush to spawn other drush instances. Otherwise the debugger may get stuck without any response.
(2) Disable “Force break at the first line when a script is outside the project.” Since the main drush binary resides in cli in /usr/local/bin/drush, the debugger will break on every drush invocation.
Note: If using Drush 8.x, path mappings for the Drush binary will need to be set in PHPStorm.
(1) Set Name and Hostname to project’s virtual host (VIRTUAL_HOST)
(2) Map the project root to /var/www. Additionally map the project level Drush binary to /usr/local/bin/drush.
You can run your scripts in console and debug them in the same way as browser requests. For example, you can run drush command: fin drush fl and debug this drush command from the Features module.
Resources
Debugging with NetBeans
1) Follow the Setup instructions to enable Xdebug in cli 2) Open NetBeans Debugging configuration (“Tools> Options > PHP > Debugging”) and set “DebuggerPort” to 9000 3) Open your project in NetBeans 4) Configure project properties:
- Right mouse click on project name, then “Properties” from the dropdown menu
- Under “Sources”, set correct Web Root folder by clicking “Browse” button (usually it’s
docroot) - Under “Run Configuration”, use project’s virtual host (
VIRTUAL_HOST) to set the Project URL - Click “OK” to save project properties
5) Set a breakpoint wherever you like
6) In NetBeans, with the whole project selected or one of the project files opened and active, press <CTRL> + <F5> on your keyboard to start the debugger
Debugging with Atom
1) Follow the Setup instructions to enable Xdebug in cli 2) Install PHP-Debug Plugin 3) Configure PHP Debug Settings (Preferences > Packages)
- Search for “php-debug”
- Click “Settings” button below plugin
- “Server” can be set to
* - “Server Listen Port” should be set to 9000
- Make sure “Continue to listen for debug sessions even if the debugger windows are all closed” is checked. This will make the debugger window open automatically.
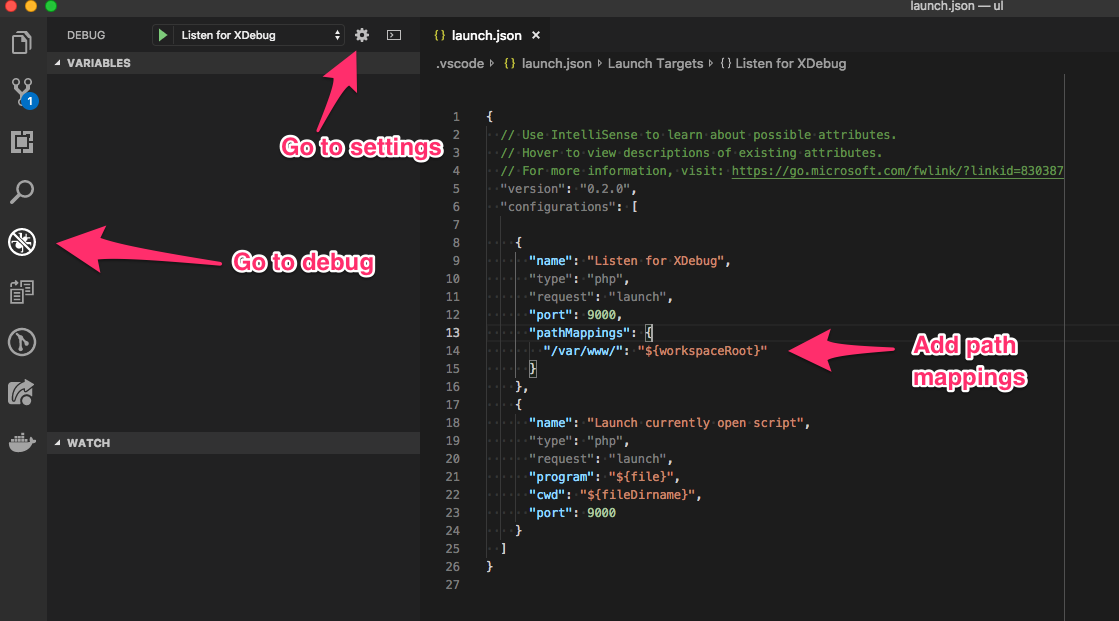
Debugging with Visual Studio Code
1) Install PHP_Debug Plugin 2) Configure PHP Debug Settings
- Click Debug Icon in left sidebar
- Click Configuration Gear in top bar
- Set port to 9000
- Add Path Mappings should be configured properly
Here is an an example of what launch.json should look like:
{
  "version": "0.2.0",
  "configurations": [
    {
      "name": "Listen for XDebug",
      "type": "php",
      "request": "launch",
      "port": 9000,
      "pathMappings": {
        "/var/www/": "${workspaceRoot}"
      }
    },
    {
      "name": "Launch currently open script",
      "type": "php",
      "request": "launch",
      "program": "${file}",
      "cwd": "${fileDirname}",
      "port": 9000
    }
  ]
}
For debugging Drush commands in VSCode with XDebug and Docksal, you will need to add a path mapping to the Drush executable.
File Mapping Drush 8.x
- Add
"/usr/local/bin/drush": "${workspaceRoot}/bin/drush"topathMappingsin yourlaunch.jsonfile.
File Mapping Drush 9.x
- Add
"/usr/local/bin/drush": "${workspaceRoot}/vendor/bin/drush"topathMappingsin yourlaunch.jsonfile.
Here is an an example of what launch.json should look like:
{
  "version": "0.2.0",
  "configurations": [
    {
      "name": "Listen for XDebug",
      "type": "php",
      "request": "launch",
      "port": 9000,
      "pathMappings": {
        "/var/www/": "${workspaceRoot}",
        "/var/www/vendor/bin/drush": "${workspaceRoot}/bin/drush"
      }
    },
    {
      "name": "Launch currently open script",
      "type": "php",
      "request": "launch",
      "program": "${file}",
      "cwd": "${fileDirname}",
      "port": 9000
    }
  ]
}
- Ensure that your docksal.yml or docksal-local.yml has been updated to include
XDEBUG_ENABLED=1in the CLI. This is off by default due to performance. - If changes were made, be sure to run
fin upto update your environment.
Here is an an example of what docksal-local.yml should include:
version: "2.1"
services:
  cli:
    environment:
      - PHP_IDE_CONFIG=serverName=${VIRTUAL_HOST}
- Use
fin exec /var/www/vendor/bin/drush <site alias> <drush command>to run the command you want to debug.